On this page
- How much radon does each mitigation method remove?
- What radon level should you expect after mitigation?
- Does it matter who installs the system? 19 percent DIY vs. 88 percent certified
- What does Pennsylvania data show? 1,734 tests in Manheim Township
- Is under 4 pCi/L good enough after mitigation?
- How we compiled this data
- Key takeaways
- Frequently Asked Questions
- Get a system built to reach your target
Everyone who gets a high radon result asks the same two questions: will a system actually bring my number down, and down to what? The data gives a clear answer. A properly installed active system usually lands a home near 1 pCi/L, and in its 2025 national cost-benefit analysis, the EPA assumes a mitigated home drops to 1.0 pCi/L, one quarter of the 4.0 action level. Field studies back that up, and they show something most guides skip: who does the certified radon system installation changes the result more than which system gets installed.
This page pulls the measured before-and-after numbers into one place. For the plain-language basics first, see do radon mitigation systems actually work.
How much radon does each mitigation method remove?
The EPA rates every active suction method at 50 to 99 percent typical radon reduction. Passive sub-slab suction without a fan drops to 30 to 70 percent, and natural crawl space ventilation to 0 to 50 percent. The fan is what separates a reliable fix from a partial one.
| Method | Typical radon reduction | Source |
|---|---|---|
| Active sub-slab suction | 50 to 99 percent | EPA Consumer's Guide |
| Drain tile suction | 50 to 99 percent | EPA Consumer's Guide |
| Sump-hole suction | 50 to 99 percent | EPA Consumer's Guide |
| Crawl space sub-membrane depressurization | 50 to 99 percent | EPA Consumer's Guide |
| Passive sub-slab suction (no fan) | 30 to 70 percent | EPA Consumer's Guide |
| Crawl space natural ventilation | 0 to 50 percent | EPA Consumer's Guide |
Every active method in the EPA table works the same way: a fan pulls soil gas from under the house and vents it above the roof before it can seep indoors. The method name only describes where the suction point goes, which is why sub-slab depressurization shares its range with drain tile, sump and membrane systems. Where a home lands in that wide range depends on the material under the slab, the number and placement of suction points, and how well the openings around them are sealed.
The weak rows matter as much as the strong ones. Passive pipes and open crawl space vents depend on natural air movement, which changes with the weather and the season. That is why builders install a passive pipe in new homes but leave room for a fan.
What radon level should you expect after mitigation?
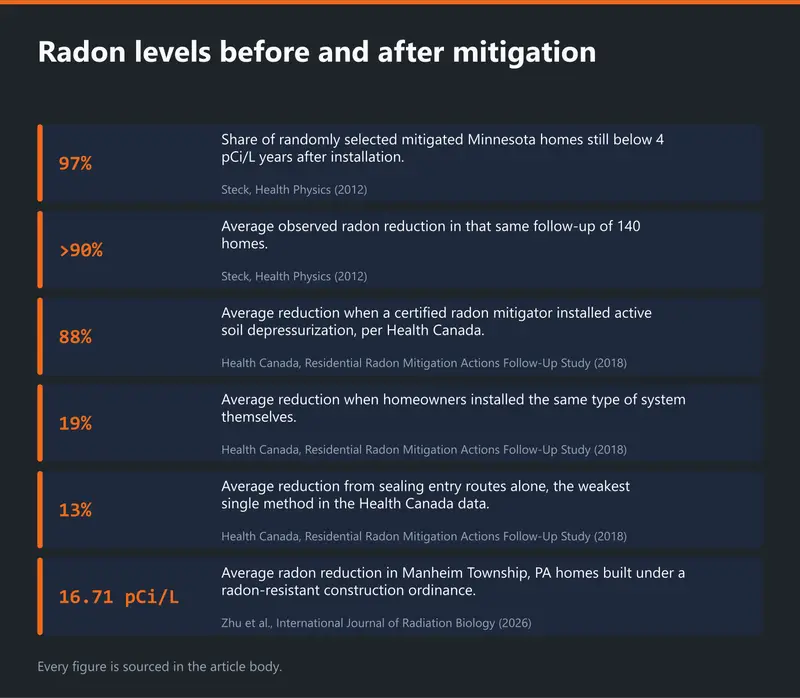
About 1 pCi/L. The EPA's 2025 model uses 1.0 pCi/L as the post-mitigation level, and the EPA's homeowner guide says most homes can be reduced to 2 pCi/L or below. A random follow-up of 140 mitigated Minnesota homes found 97 percent still under the action level years later.
| Measure | Value | Source |
|---|---|---|
| Post-mitigation level used in the EPA's national model | 1.0 pCi/L | EPA, 2025 |
| Level most homes can be reduced to | 2 pCi/L or below | EPA Consumer's Guide |
| Homes in the Minnesota follow-up | 140 | Steck, Health Physics, 2012 |
| Average pre-mitigation screening level | 10.3 pCi/L | Steck, 2012 |
| Average post-mitigation level | 30 Bq/m³ (under 1 pCi/L) | Steck, 2012 |
| Average observed reduction | More than 90 percent | Steck, 2012 |
| Homes still below 4 pCi/L years later | 97 percent | Steck, 2012 |
The Minnesota study is the strongest evidence here because the homes were picked at random from the client lists of six professional mitigators. They were not chosen because they had problems or because they were showcase jobs. Homeowners started at an average of 10.3 pCi/L, roughly two and a half times the action level. Long-term tests on the two lowest floors found an average reduction of more than 90 percent.
A larger and more recent dataset points the same way. A 2024 review of about 2,800 mitigated UK homes found a single active system cut radon by up to 5.5 times, a drop of more than 80 percent, and combined active systems by up to 8.3 times, while the best passive method managed only 1.8 times. The combined figure is the one to remember for harder houses, such as a basement plus a crawl space, where one suction point cannot reach the whole foundation. Our guide on how a radon mitigation system works shows how those extra suction points fit together.
The EPA's 1.0 pCi/L assumption comes from field studies of mitigated homes, including work by the same Minnesota researcher. The result to judge is a long-term average, not a single short test the day after install. A home that settles well above the typical landing point is telling you something about the installation, and a gauge check is the quickest first step. Our guide to reading a radon manometer shows what normal suction looks like.
Does it matter who installs the system? 19 percent DIY vs. 88 percent certified
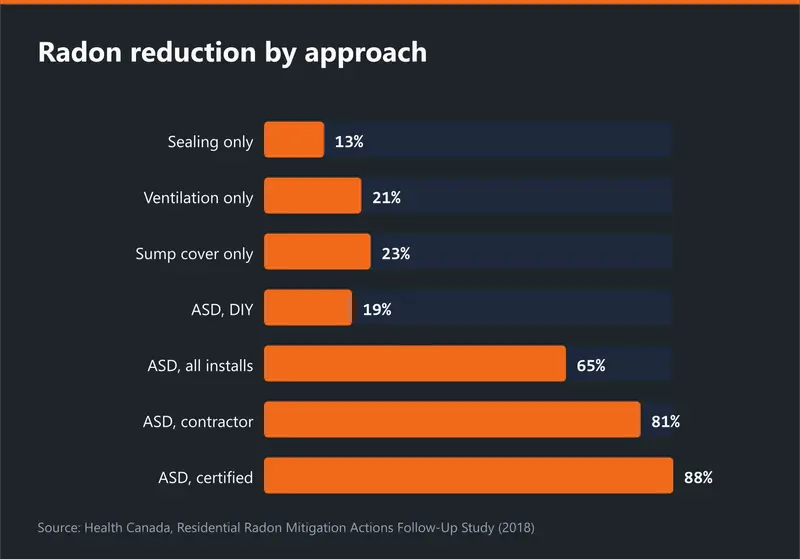
Yes, more than any other variable in the data. In Health Canada's mitigation follow-up study, active soil depressurization averaged a 65 percent reduction overall. It averaged 19 percent when homeowners installed it, 81 percent for contractors and 88 percent for certified radon mitigators. Sealing alone averaged only 13 percent.
| Approach | Average radon reduction | Source |
|---|---|---|
| Active soil depressurization, certified mitigator | 88 percent | Health Canada, 2018 |
| Active soil depressurization, contractor | 81 percent | Health Canada, 2018 |
| Active soil depressurization, all installers | 65 percent | Health Canada, 2018 |
| Sealing or covering the sump pit only | 23 percent | Health Canada, 2018 |
| Increased ventilation only | 21 percent | Health Canada, 2018 |
| Active soil depressurization, homeowner (DIY) | 19 percent | Health Canada, 2018 |
| Sealing entry routes only | 13 percent | Health Canada, 2018 |
This is the gap no single EPA range can show. The method is the same across the three installer groups. The difference is suction-point placement, fan sizing, sealing and the diagnostic work that comes before any pipe goes in. Health Canada also found that only about 70 percent of people who took some action saw their radon drop at all, a reminder that many so-called mitigations are partial steps rather than complete systems.
One caution: the figures are self-reported by homeowners, and the public summary does not publish how many homes are in each installer group. Treat the exact percentages as directional. The direction itself is clear.
The single-method rows explain the DIY result. Homeowners tend to start with what they can do themselves, and sealing alone or a sump cover alone averaged under a quarter of the radon removed. Both belong in a full system, as our guide on whether sealing cracks reduces radon explains, but neither replaces one. If you are weighing a weekend project, DIY radon mitigation in Pennsylvania covers what state rules allow and why homemade systems often struggle to pass a clearance test.
What does Pennsylvania data show? 1,734 tests in Manheim Township
About 40 percent of Pennsylvania homes tested are above the EPA action level, according to PA DEP. In nearby Manheim Township, an analysis of 1,734 radon tests in 483 homes found that houses built under a radon-resistant construction ordinance averaged 16.71 pCi/L less radon.
| Measure | Value | Source |
|---|---|---|
| Pennsylvania homes tested above the action level | About 40 percent | PA DEP |
| Radon tests analyzed, Manheim Township | 1,734 | Zhu et al., International Journal of Radiation Biology, 2026 |
| Homes analyzed | 483 | Zhu et al., 2026 |
| Average reduction with radon-resistant construction | 16.71 pCi/L | Zhu et al., 2026 |
| Estimated drop in excess lung cancer risk from radon | 99 percent | Zhu et al., 2026 |
Manheim Township, in Lancaster County, is the closest thing to a local before-and-after experiment. The township made radon-resistant features mandatory in new homes, and researchers compared PA DEP test records for homes built with and without them, after correcting reporting errors in the state database. The average drop of 16.71 pCi/L is larger than the action level itself, which says as much about how high untreated levels run in this part of Pennsylvania as it does about the construction method.
York County sits on similar geology and is in EPA Radon Zone 1, the highest potential zone. No public dataset reports post-mitigation results for York County homes on their own, so the statewide and Manheim figures are the best local guide available.
Is under 4 pCi/L good enough after mitigation?
It meets the EPA action level of 4 pCi/L, but the EPA also says to consider fixing between 2 and 4 pCi/L, and the World Health Organization's reference level is 100 Bq/m³, about 2.7 pCi/L. Since working systems typically land near 1 pCi/L, a result just under 4 usually means the system can do better.
| Benchmark | Value | Source |
|---|---|---|
| EPA action level | 4 pCi/L | EPA |
| EPA range where fixing is worth considering | 2 to 4 pCi/L | EPA |
| WHO reference level | 100 Bq/m³ (about 2.7 pCi/L) | WHO |
| Lung cancer risk increase per 100 Bq/m³ of long-term radon | About 16 percent | WHO |
This is a common question on radon forums: a homeowner gets a clearance test just under 4 and asks whether to accept it. The data says the action level is the point for deciding to mitigate, not the target for the finished system. The WHO estimates lung cancer risk rises about 16 percent for every 100 Bq/m³ of long-term exposure, with no level where the risk disappears, so a home sitting at 3.8 and one sitting at 1.0 are not the same.
A system that only gets a home into the high threes often has a fixable cause: an undersized fan, a missed suction area, an unsealed sump or a crawl space left out of the design. That is why a written performance target, typically under 2 pCi/L, belongs in any quote, along with a clearance test to prove it.
How we compiled this data
We gathered every published source we could find that reports measured radon levels or reductions after mitigation, then kept only primary sources:
- EPA, Analysis of Benefits and Costs of Radon Reduction Strategies (2025)
- EPA, A Consumer's Guide to Radon Reduction
- EPA, Map of Radon Zones and Supplemental Information
- Steck, "The effectiveness of mitigation for reducing radon risk in single-family Minnesota homes," Health Physics (2012)
- Health Canada, Residential Radon Mitigation Actions Follow-Up Study (2018)
- Kouroukla, Gooding and Fonseca, "Analysis of radon mitigation methods: 10-year review," Journal of Radiological Protection (2024)
- Zhu, Fox, Corrigan and Locke, "Reducing lung cancer risk from radon exposure in Manheim Township, PA," International Journal of Radiation Biology (2026)
- PA DEP, Radon in the Home
- World Health Organization, Radon and Health
Every figure was checked against its source page in October 2026. The Health Canada installer figures are self-reported and the summary does not give group sizes. The Minnesota study used homeowner-reported screening results for the starting levels. We will update this page when the EPA or PA DEP publishes new mitigation data.
Key takeaways
- A properly installed active system usually brings a home near 1 pCi/L. The EPA's 2025 model assumes 1.0 pCi/L.
- In a random follow-up of 140 mitigated homes, 97 percent stayed under 4 pCi/L years later, with an average reduction above 90 percent.
- Who installs the system matters: Health Canada found 19 percent average reduction for DIY active systems, 81 percent for contractors and 88 percent for certified mitigators.
- Sealing alone averaged 13 percent and a sump cover alone 23 percent. Both help as part of a system, not instead of one.
- Radon-resistant construction cut radon by an average of 16.71 pCi/L in Manheim Township, PA.
- Under 4 pCi/L meets the action level, but a well-built system should reach 1 to 2 pCi/L.
Frequently Asked Questions
What should my radon level be after mitigation?
Expect a long-term average well under 2 pCi/L. The EPA says most homes can reach 2 pCi/L or below, and its 2025 national model assumes a mitigated home lands at 1.0 pCi/L. A random follow-up of 140 Minnesota homes averaged 30 Bq/m³ after mitigation, which is under 1 pCi/L.
How much does a radon mitigation system reduce radon?
The EPA puts active sub-slab suction at 50 to 99 percent. Field data lands near the top of that range: the Minnesota follow-up found an average reduction above 90 percent, and Health Canada found certified installers averaged about 88 percent.
Does DIY radon mitigation work as well as a professional system?
Not in the published data. In Health Canada's follow-up study, homeowner-installed active systems averaged a 19 percent reduction, against 81 percent for contractors and 88 percent for certified mitigators.
Does sealing cracks lower radon?
Only a little on its own. Health Canada measured an average reduction of about 13 percent when sealing entry routes was the only step taken, and the EPA does not recommend sealing alone because it has not been shown to lower radon significantly or consistently.
Do radon systems keep working years later?
Usually. In a random sample of 140 Minnesota homes, 97 percent were still below 4 pCi/L years after installation. The EPA's cost model assumes the fan is replaced about every 10 years, so a working system needs occasional maintenance and a retest every two years.
Is under 4 pCi/L good enough after mitigation?
Under 4 meets the EPA action level, but the EPA also says to consider fixing between 2 and 4 pCi/L, and the WHO reference level is about 2.7 pCi/L. A well-built system typically reaches 1 to 2 pCi/L, so a result just under 4 usually means the system can be improved.
Get a system built to reach your target
We design each system around your home's foundation and back it with a written clearance guarantee. Call (717) 356-3035 any time for a free written quote and a same-day callback.